
This piece was first published at aggravations.org on 6 July 2016
Those of us interested in the differences between ‘city’ and ‘country’ in Australia might like to know how the recent Federal Election turned out in this respect.
The short answer is that there was a gradient from the electorates in metropolitan, to outer metropolitan and then to rural areas. On average, the more rural the electorate, the higher the swing from the Coalition and to the ALP.
It would be nice to know what caused this. Since this gradient accurately reflects so many other social and economic variables, which get worse with greater rurality, perhaps it reflects a general sense of alienation with governments that don’t seem to recognise the particular challenges and opportunities of life in rural and remote Australia.
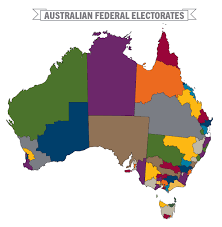
Conveniently, the Australian Electoral Commission (AEC) has three categories in its classification of electorates. The first is comprised of the city electorates which between them constitute the capital cities. Next are electorates the AEC describes as ‘Capital City Surrounds’. This category only exists for the surrounds of Melbourne, Sydney and Brisbane. In Western Australia and South Australia electorates are defined by the AEC either as being in a capital city or rural.
‘Rural’ is in effect the third AEC category, although it should be noted that the AEC does not use that term for them.
A three-point classification therefore emerges from the AEC’s mapping: what might be called Metropolitan (for all capital cities), what we can call Metropolitan surrounds (for electorates around Sydney, Melbourne and Brisbane; and rural.
The first question to be answered is whether there were different average swings against the Coalition and to the ALP in these three distinct regions.
Analysis reveals that the answer is yes, at least in a political sense. I will leave it to others to determine the extent to which the differences are of statistical significance and, if so, at what level of probability.
A number of electorates were excluded from the analysis. Seven were excluded because, after the distribution of preferences, the result of this year’s election saw the first and second placed candidates being someone from one of the three major parties and a second person being a member of the Greens, the Nick Xenophon Team or an independent. In contrast, the election in 2013 saw head-to-head contests between one of the parties in the Coalition and the ALP.
These changed circumstances led to outlier or ‘rogue’ statistics ranging from a notional swing of 51.5% to the Liberals in Grey, where a candidate from the Nick Xenophon party came second; to a notional swing of 66.07% to the ALP in Grayndler where the runner-up was a member of the Greens.
The other five excluded on these grounds were Mayo (won by the Nick Xenophon Team), Warringah, Higgins, Cowper and Barker.
The other exclusions are those electorates in which a minor party was or had been successful in the 2013 election: Melbourne, Indi, Fairfax, Denison and Kennedy; New England where Tony Windsor, an independent, came second; and Murray, where the first and second where the candidates for the Liberal and National Parties.
For the purposes of the analysis, Solomon (Darwin) and Herbert (Townsville) were both considered to be Metropolitan electorates, in the case of Herbert because of the population size of Townsville.
Setting aside those 14 special cases, the analysis was then performed on 136 electorates: 74 Metropolitan, 31 Metropolitan surrounds, and 31 rural.
The analysis therefore measures the swing from the Coalition to the ALP in seats where the two of them finished first and second after the distribution of preferences in both 2013 and this year.
The average swing to the ALP in these three classes was:
⦁ 2.31 per cent in Metropolitan electorates;
⦁ 3.48 per cent in Metro surrounds; and
⦁ 3.82 per cent in rural electorates.
The analysis undertaken did not account for particular circumstances which resulted in specific swings, such as when a well-known and long-standing member retires.
Table: Average swings in 136 electorates from the Coalition to the ALP between the 2013 and 2016 Federal elections
Jurisdiction Metro. Metro. surrounds Rural
Av. % Av. % Av. %
NSW 3.01 4.68 3.26
Victoria -0.13 2.81 2.90
Queensland 1.98 3.13 3.24
South Australia 4.14 – Wakefield 7.48
W.A. 3.94 – 3.17
ACT; Darwin 3.27 – –
Tasmania – – 5.95
Total 2.31 3.48 3.82
Analysed this way, and given the caveats described, the overall average in the 136 electorates was a swing from the Coalition to the ALP of 2.92 per cent.
As can be seen from the table, the best performer for the Coalition was metropolitan Melbourne where there was actually a very small average swing its way. The best performer for the ALP (discounting single electorates) was Tasmania outside Hobart. In New South Wales the Metropolitan surrounds seats did particularly well for the ALP.
Hopefully this has piqued your interest in what politics might mean for rural people.